ANNUAL REPORT ON ARCHITECTURAL EDUCATION
If you are in architecture, be it an architecture student, emerging professional, or an architect, you owe it to yourself to review the NAAB Annual Statistical Report. In fact, we would argue that you should access and review any and all data on the architecture profession. Over the next week or so, we will share some of that data.
NAAB Annual Statistical Report
https://www.naab.org/wp-content/uploads/2019_NAAB-Annual-Report.pdf
Why is it important? In our humble opinion, it is important to know what is happening within architectural education to gain a fuller understanding of the profession. Do you know how many architecture students there are in the programs? Do you know the salaries of your faculty?
Every year, each program must complete the annual statistical report consisting of what is outlined by NAAB below.
The annual statistical report captures information on both the institution in which an architecture program resides and the program itself. The statistical report consists of seven sections: (1) institutional characteristics; (2) NAAB-accredited architecture programs; (3) tuition, fees, and financial support for students; (4) student characteristics; (5) degrees awarded; (6) resources for students and learning; and (7) human resources.
Now, we will share the highlights and strongly encourage you to download and review the full annual report.
NAAB Annual Statistical Report
https://www.naab.org/wp-content/uploads/2019_NAAB-Annual-Report.pdf
ACCREDITED PROGRAMS,
In AY 2018–19, 168 accredited programs were housed in 139 institutions with U.S. regional accreditation. Of the 168 programs, 112 (62%) are Master of Architecture programs, 55 (30%) are Bachelor of Architecture programs, and 1 (1%) is a Doctor of Architecture program. In addition, there are 14 programs in candidacy in AY 2018–19, eight were M. Arch. programs and six were B. Arch. programs.
ENROLLMENT
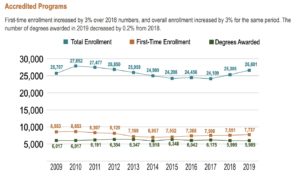
There are 26,061 students enrolled in NAAB-accredited degree programs: of this total, 15,160 (58%) are enrolled in Bachelor of Architecture programs, 10,845 (42%) in Master of Architecture programs, and 56 (0.2%) in Doctor of Architecture programs.

Overall, enrollment in accredited programs increased by a net of 756 students, or 3%, from AY 2017–18, when 25,305 students were enrolled in accredited degree programs. And, it is only a minimal increase over the AY 2008-09 total of 25,707 – less than 1% increase.
The gender breakdown of enrolled students is 13,285 (51%) males and 12,776 (49%) females. In 2017–18, the percentage breakdown was 54% male students and 46% female students.
Although enrollment by students who indicated white for ethnicity has been steadily declining since 2009, in 2018–19 it remained steady at 40%. The fastest growing category of ethnicity is nonresident alien. In 2009, this category accounted for 6% of enrollment overall; in 2019, it was 19%. Enrollment of Black/African American students has remained flat over the past ten years, hovering at 5% of total enrollment each year.
First-Time Enrollment in Accredited Programs
There are 7,737 newly matriculated students enrolled in NAAB-accredited degree programs for the academic year 2018–19; this number represents a 2% increase over first-time enrollment in 2017–18. The number of new students is approximately 30% of all students enrolled in accredited programs. Of this total, 3,723 (48%) are enrolled in B. Arch. programs, 3,936 (51%) in M. Arch. programs, and 78 (1%) in D. Arch. degree programs.
DEGREES AWARDED
A total of 5,985 accredited degrees were awarded in AY 2018–19: 3,527 (59%) were M. Arch. degrees; 2,446 (41%) were B. Arch. degrees; and 12 (0.2%) were D. Arch. degrees. The number of degrees awarded in 2018–19 represents a .02% decrease from AY 2017–18.
The gender breakdown for degrees awarded is 3,158 (53%) males and 2,827 (47%) females. These percentages illustrate a 1% increase in male students and a 1% decrease in female students from AY 2017–18. The distribution by gender for degrees awarded is statistically the same for all accredited degrees. The gender breakdown for overall enrollment is 54% males and 46% females.
_______
Now, you know the basic statistics of architectural education, but do review the full annual report for additional statistics.
NAAB Annual Statistical Report
https://www.naab.org/wp-content/uploads/2019_NAAB-Annual-Report.pdf
Source: NAAB (2020) 2019 Annual Report on Architectural Education. Washington, DC: NAAB
